Advanced Reports for Pharma
The Advanced Reports for Pharma feature allows you to generate reports that display the details for laboratories, clean rooms, filling rooms, and storage rooms found in the pharmaceutical industry. In order to work with Pharma Reports, you must install the Advanced Reports for Pharma extension and add it to a management station project. The extension contains templates that allow you to generate the following reports:
- Alarms Summary Report
- Audit Trail Report
- Statistic Summary MKT Report
- Trend Chart Report
- Trend Chart Report with Multi-Axis
- Trend Table Report
The Pharma Reporting application uses the data stored in the Desigo CC Historical Database to show details like Room Pressurization, Storage Temperatures, Mean Kinetic Temperatures, and Alarm states. You can create User Views corresponding to floor plans and other organizational structures so that the parent folder for each organizational group contains the data points to be displayed together using an Advanced Reporting template.
You can also configure common parameters using the Pharma Reports Setting on the Configuration Page for Advanced Reporting. Once you run a report with the desired parameters, you can then schedule it to run automatically based on a trigger time and date.
For procedures or workflows, see the step-by-step section.
This report is designed to show alarm details and summaries for multiple devices over a selected time range. The report can be adjusted with a parameter to allow the most frequent alarms.
Sample report
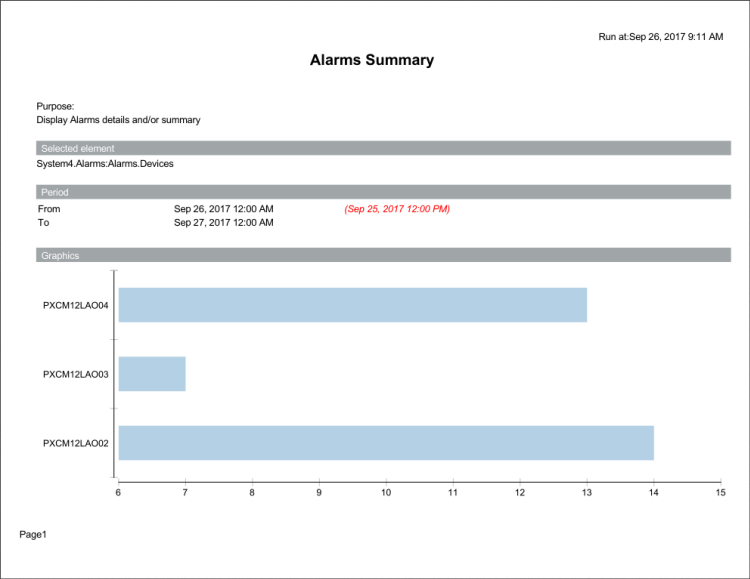
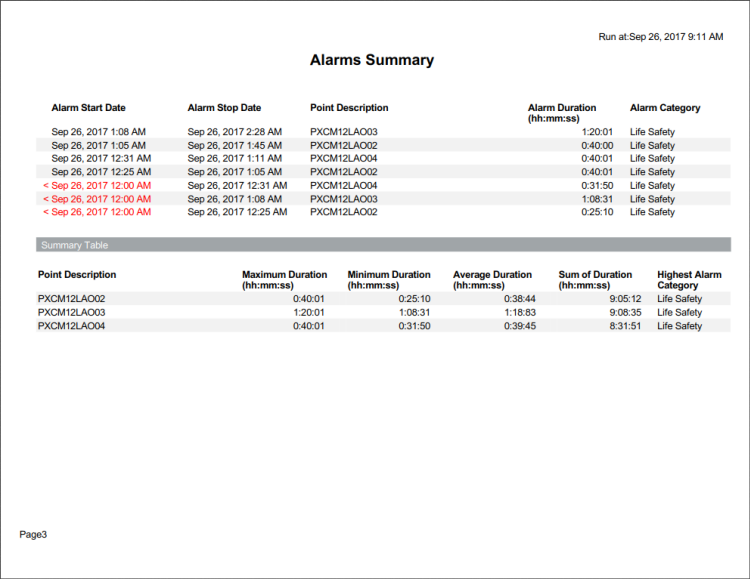
Legend
Indicator | Description for Table |
Red Value in Period Section | When an alarm appears, a red value in the Period section indicates the real From lookup time before the requested period in the report. Note: the number of hours to lookup is defined in global pharma parameters. |
Red Value in Detail Section | A red time stamp indicates that an alarm has appeared or disappeared outside of the requested period in the report. |
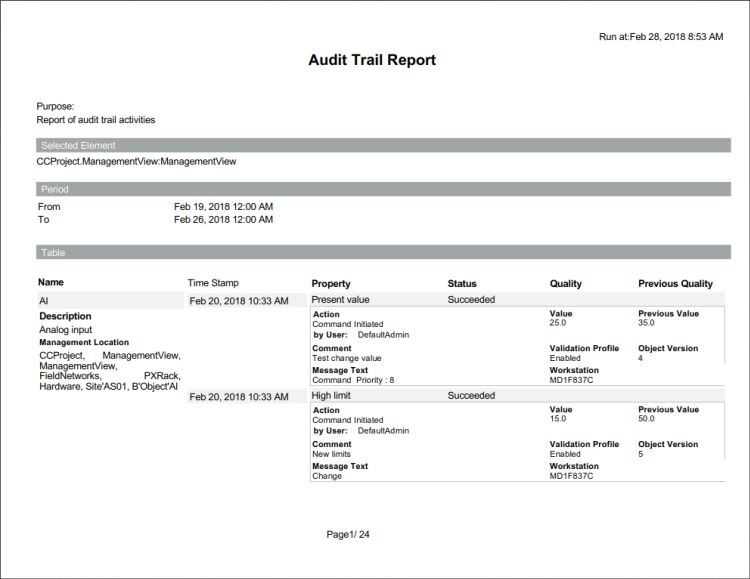
This report is designed to show audit trail activities.
Sample report
This report shows key statistical summaries including Mean Kinetic Temperature (MKT).
About mean kinetic temperature
MKT is often used in the pharmaceutical industry for warehousing and stability applications. It is a calculated temperature value that includes the effects of temperature variations over a period of time. MKT expresses the cumulative thermal stress experienced by a product at varying temperatures during storage and distribution.
Mean Kinetic Temperature differs from other means (such as a simple numerical average or arithmetic mean) because higher temperatures are given greater weight in computing the average. This weighting is determined by a geometric transformation—the natural logarithm of the temperature number.
Disproportionate weighting of higher temperature in a temperature series according to the MKT recognizes the accelerated rate of thermal degradation of materials at these higher temperatures. MKT accommodates this non-linear effect of temperature.
Sample report
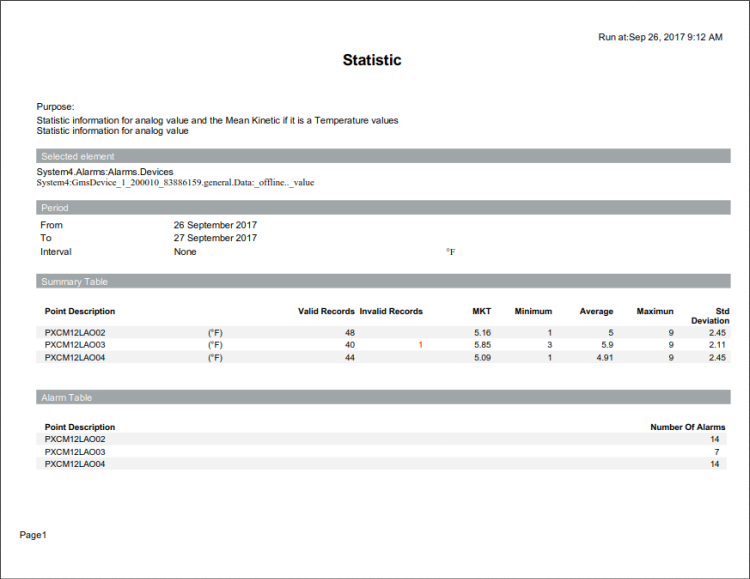
Legend
Indicator | Description for Table |
Red Value in Summary Table Section | Highlights the number of bad or invalid records found in trend and not used to do a calculation for MKT/Min/Max/Average and standard deviation. |
This report is designed to display a chart or table of trend data for multiple devices over a specified range of time.
NOTE: While running a Trend chart report, you might receive an exception error if there are more trend series in the report than entries in the associated text group. You can correct this problem by customizing the Pharma List Series text group and then adding new rows with colors to match the number of trend series in the report.
For information on customizing the text group, see the following topic:
Engineering Step-by-Step > Other Applications > Advanced Reports for Pharma > Additional Advanced Reports for Pharma Procedures > Customize the Pharma List Series Text Group
For information on adding rows to the text group once it has been customized, see the following topic:
Engineering Step-by-Step > Other Applications > Text Group Editor > Adding a Row to a Text Group
Sample report
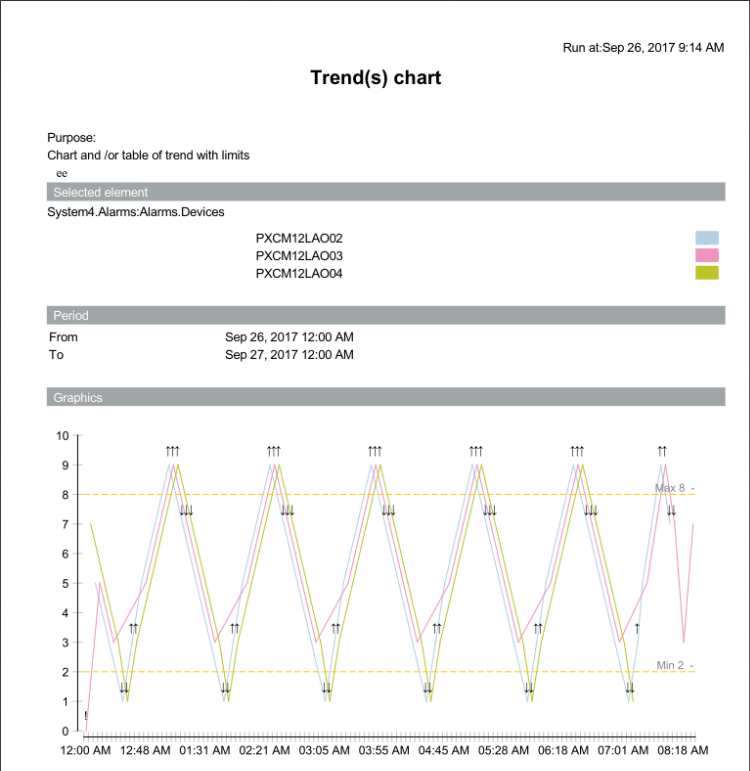
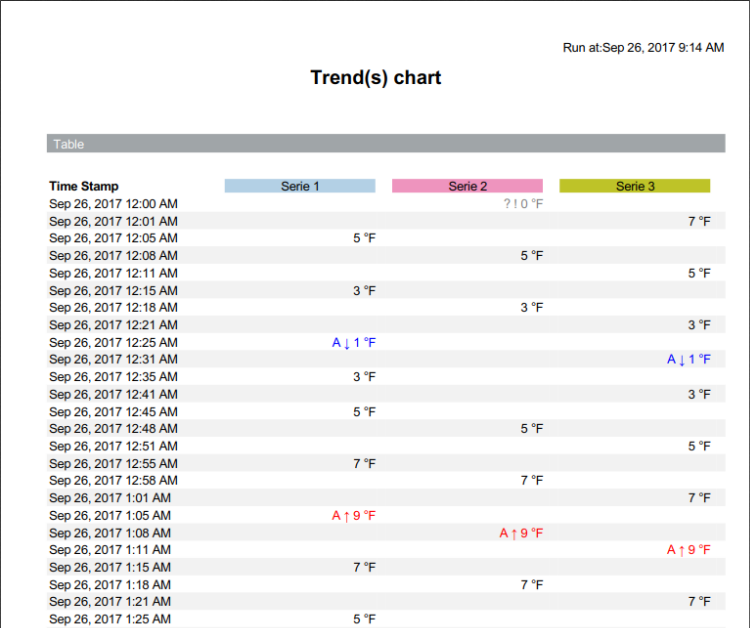
Legend
Indicator | Description for Table | Description for Graphic |
! | Bad value | Bad value |
Arrow Up – Red | Over high limit | Pass high limit or return from low limit |
Arrow Down – Blue | Below low limit | Return from or pass low limit |
Pencil | Manual correction | Manual correction |
? | Fault | Not applicable |
A | Alarm | Not applicable |
OfS | Out of Service | Not applicable |
This report is designed to show a maximum of 10 trends, each with an independent Y-axis. A parameter allows merging and combining the same category of trends in the same axis.
Sample report
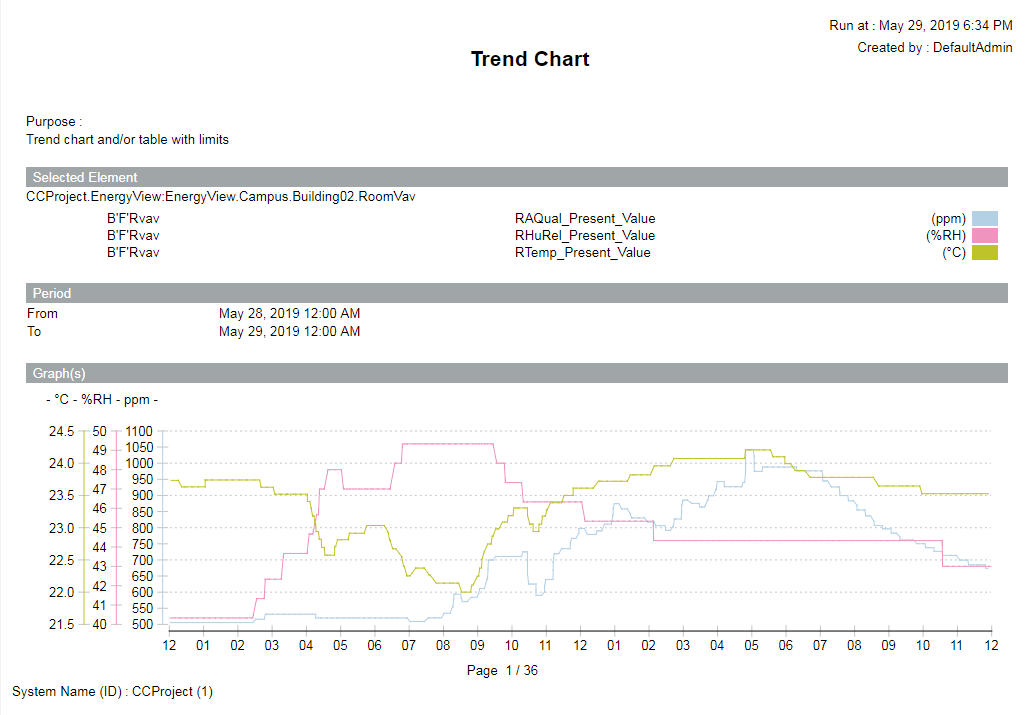
Legend
Indicator | Description for Table | Description for Graphic |
! | Bad value | Bad value |
Pencil | Manual correction | Manual correction |
? | Fault | Not applicable |
A | Alarm | Not applicable |
OfS | Out of Service | Not applicable |
This report is designed to show values of multiple trended objects compared over a range of time.
Sample report
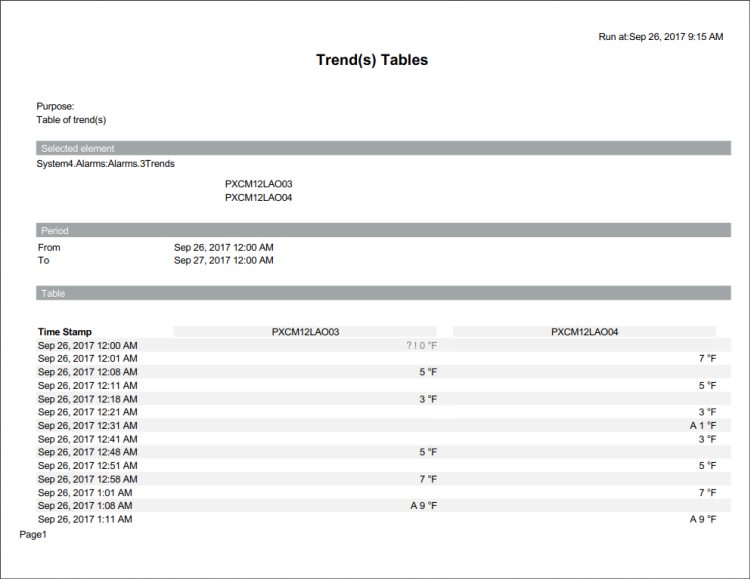
Legend
Indicator | Description for Table | Description for Graphic |
! | Bad value | Bad value |
Arrow Up – Red | Over high limit | Pass high limit or return from low limit |
Arrow Down – Blue | Below low limit | Return from or pass low limit |
Pencil | Manual correction | Manual correction |
? | Fault | Not applicable |
A | Alarm | Not applicable |
OfS | Out of Service | Not applicable |
Properties of Links | ||
Parameter | Label | Value |
P1 | Report Template | Name of the report template. |
P2 | Format | Output format of the report may be PDF, HTML, XLSX, DOCX. |
P3 | Data Range | Specify Time Range for the report data. |
P4 | Interval | Time interval |
P5 | Enable Limits Trend Chart | Specify how horizontal limits should display in the report. |
P6 | High Limit | Upper limit line value. |
P7 | Low Limit | Lower limit line value. |
P8 | Alternative Title | Optional title displayed at the top of the report. |
P9 | Display Elements | Optional Charts and Data Grids can be chosen. |
P10 | Connect Missing Value and Axis (Semi-Colon for Separator) | Specify what to display in charts when data is unknown. For Trend Axis For Trend Multi-Axis |
P11 | Alternative Purpose | Optional purpose and text description displayed near the top of the report. |
P12 | Display Elements in table for Audit Trail and Alarm summary | Specify how display elements appear in the table: 0 – time line |
For a saved report (Advanced Reporting Links report in Application View > Applications > Links), you should use the following P3 values in the Extended Operations tab. The case and the number of spaces must match the P3 values shown in the table.
Time Range for Report Content | |
Parameter Dialog Box | P3 Value |
None | - |
Last Day | last day |
Last Week | last week |
Last Month | last month |
Last Quarter | last quarter |
Last Year | last year |
Rolling Hours | last hour |
Rolling 6 Hours | now -6hour |
Rolling 12 Hours | now -12hour |
Rolling Day | now -24hour |
Rolling Week | today -7D |
Rolling Month | today -1M |
Rolling Quarter | today -3M |
Rolling 100 Days | today -100D |
Rolling 200 Days | today -200D |
RollingYear | today -1Y |
Current Day | current day |
Current Week | current week |
Current Month | current month |
Current Quarter | current quarter |
Current Year | current year |
One year from same Day last year | current day -12M |
One year from same Week Last year | current week -12M |
One year from same Month Last year | current month -12M |
One year from same Quarter Last year | current quarter -12M |
2 Weeks ago | current week -2W |
2 Months ago | current month -2M |
2 Quarters ago | current quarter -6M |
Timeline Order | |
Parameter Dialog Box | P5 Value |
Ascending | 0 |
Descending | 1 |
Alarm Summary Report | Value | Meaning |
0 | All elements | |
1 | Graphics | |
2 | Details table | |
3 | Summary table | |
Audit Trail Report | Value | Meaning |
0 | Display data table in time line | |
1 | Display first by element and the time line. | |
Statistic Summary MKT Report | Value | Meaning |
0 | All elements | |
1 | Details table | |
2 | Summary table | |
3 | Alarm Count table | |
Trend Chart Report & Trend Chart Report with Multi-Axis | Value | Meaning |
0 | All elements | |
1 | Graphics | |
2 | Details table | |
3 | Display Alarm event in Graphics | |
4 | Display Legend | |
5 | Summary Table | |
Trend Table Report | Value | Meaning |
0 | All elements | |
1 | Details table | |
2 | Display Legend | |
3 | Summary Table |
Settings for Global Pharma Reports
In the Advanced Reporting configuration page, you can set the following global settings for Pharma reports.
Name | Default | Function | Reports |
Value format display | ##0.00 | Set the format of analog value in different reports. | All |
Date format for Trend | Auto | Set the format of the time. For example: | Trend Table, Trend Chart, Trend Chart with Multi-Axis |
Date format for event | Auto | Set the format of the time. For example: | Alarm Summary, Audit Trail |
Activation Energy for MKT | 83.144 | Information used to calculate the MKT value. | Statistic Summary MKT |
Default High limits value | 100 | This is the default value displayed in the Trend Chart report dialog. | Trend Chart |
Default Low limits value | 0 | This is the default value displayed in the Trend Chart report dialog. | Trend Chart |
Number of Trend series to switch description to series number | 8 | To optimize space in the Trend Table report, you can replace the point description with a number plus color in the header display. | Trend Table |
Ignore the Time shift event | True | Ignore the time shift event in different reports. Time shift can be associated with high or low value, which can influence calculation or display. | Trend Table, Trend Chart, Trend Chart with Multi-Axis, Statistic Summary MKT |
Display number of records | True | Enable/disable in the header the display of the number of records used to do Statistic Summary or MKT. | Statistic Summary MKT |
Display full hierarchy description | false | Display the full path of a datapoint—useful if you run a report for the entire project and you have a datapoint with the same description | Alarm Summary, Audit Trail |
Include “not closed” event | false | Include the active event in detail table of alarm report. Caution: These events are not used in calculation of the Min/Max/Average & Total duration. | Alarm Summary |
Format used for object description | Description | Set the description format of a data point if point description, point name, or point Alias used. For Alias: if it is not defined, the | All |
Number of most frequent alarms | null | Set a default value display in alarm report dialog. | Alarm Summary |